
Shopify conversion rates often fall between 1.6% and 3%, but that range should be treated as a reference, not a target for every store.
In 2025, 1.6% of global ecommerce visits resulted in purchases, while other datasets reported averages closer to 2.95%. The wide difference comes from variations in industry, device, traffic source, product price, location, and measurement method. Shopify’s ecommerce conversion research
A practical starting point for an established Shopify store is:
- Overall conversion rate: 2% or higher
- Mobile conversion rate: 1.5% or higher
- Desktop conversion rate: 2.5% or higher
- Mobile PageSpeed score: 70 or higher
- LCP: 2.5 seconds or less
- INP: 200 milliseconds or less
- CLS: 0.1 or less
These are not guarantees. A luxury furniture store may be healthy at 0.8%, while a store selling inexpensive repeat-purchase products may need 4% or more to be competitive.
The right question is not simply, “Is my conversion rate average?” It is:
Where are qualified customers leaving, and what should we fix first?
Shopify Speed and Conversion Benchmarks at a Glance
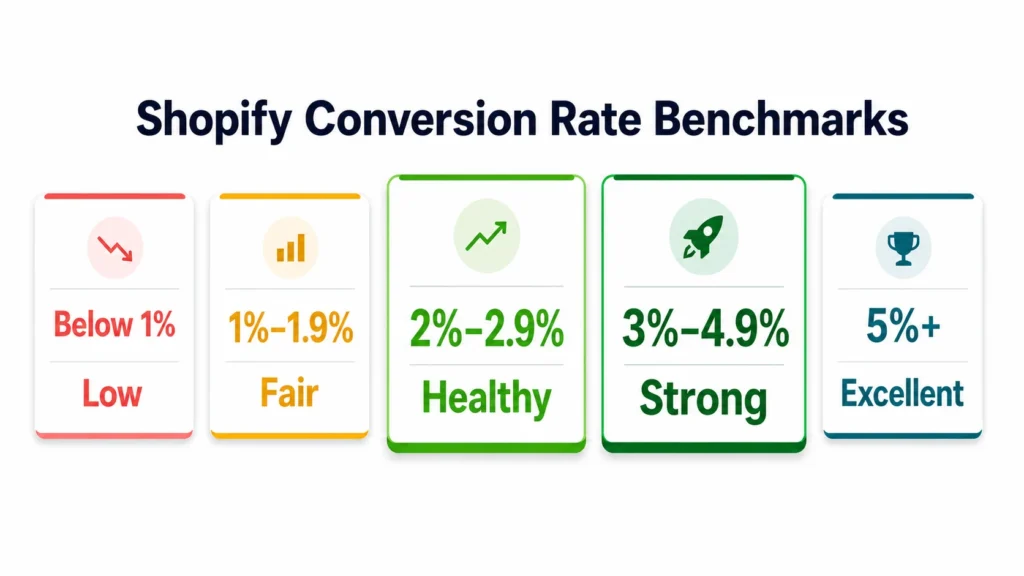
Use this table for an initial assessment:
| Store metric | Needs investigation | Reasonable | Strong |
| Overall conversion rate | Below 1% | 1%–2.9% | 3% or higher |
| Mobile conversion rate | Below 1% | 1%–1.9% | 2% or higher |
| Desktop conversion rate | Below 1.5% | 1.5%–3.3% | 3.4% or higher |
| Mobile PageSpeed score | Below 50 | 50–69 | 70 or higher |
| LCP | Above 4 sec | 2.6–4 sec | 2.5 sec or less |
| INP | Above 500 ms | 201–500 ms | 200 ms or less |
| CLS | Above 0.25 | 0.11–0.25 | 0.1 or less |
| Cart abandonment | Above 75% | 65%–75% | Below 65% |
The conversion-rate bands are practical reference ranges drawn from multiple ecommerce datasets. They are not official standards for every Shopify store.
Google’s Core Web Vitals thresholds are official. A page provides a good experience when its LCP is 2.5 seconds or less, INP is 200 milliseconds or less, and CLS is 0.1 or less at the 75th percentile of visits. Google’s Core Web Vitals guidance
What Is a Good Shopify Conversion Rate?
A conversion rate between 2.5% and 3.5% is generally considered solid for ecommerce. However, recent datasets place the broader global average anywhere from approximately 1.6% to 2.95%.
Use this practical interpretation:
| Conversion rate | Assessment | What to do |
| Below 1% | Low | Check traffic quality and the complete purchase funnel |
| 1%–1.9% | Fair | Find the largest point of abandonment |
| 2%–2.9% | Healthy | Improve product pages and high-traffic segments |
| 3%–4.9% | Strong | Protect successful elements and test selectively |
| 5% or higher | Excellent or highly qualified traffic | Confirm tracking accuracy before comparing |
A high conversion rate does not always mean that a store is performing well.
For example, a store could increase its conversion rate by stopping broad prospecting campaigns. It would receive less low-intent traffic, but it might also lose total revenue.
Review conversion rate together with:
- Total revenue
- Revenue per session
- Average order value
- Customer acquisition cost
- New customer conversion
- Returning customer conversion
- Gross profit
- Refund and cancellation rates
Calculate Your Shopify Conversion Rate
Shopify calculates online store conversion rate using:
Shopify uses sessions rather than unique visitors for this calculation. One customer may create several sessions before buying. Shopify Analytics field definitions
Do not compare your Shopify session-based rate with a report calculated from users, visitors, clicks, or product-page views. Different denominators produce different results.
Record Your Current Benchmarks
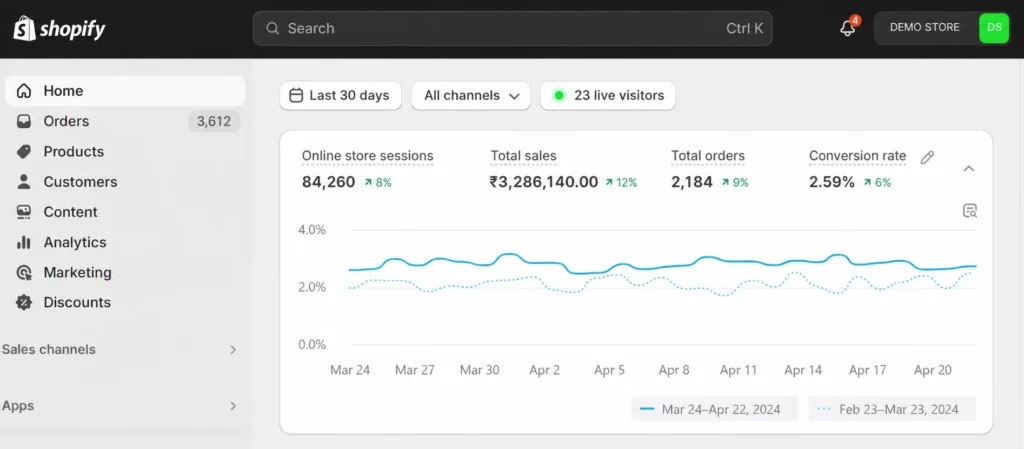
Open Shopify and select a recent 30-day period. Avoid using a week containing an unusual flash sale unless that event is what you want to study.
Replace the example figures below with your results.
| Metric | Example result | Your result | Initial assessment |
| Online store sessions | 25,000 | Record baseline | |
| Overall conversion rate | 1.8% | Fair | |
| Mobile conversion rate | 1.2% | Needs work | |
| Desktop conversion rate | 3.1% | Healthy | |
| Added-to-cart rate | 5.8% | Compare with prior period | |
| Reached-checkout rate | 3.4% | Compare with cart additions | |
| Completed checkouts | 450 | Confirm tracking | |
| Average order value | $68 | Compare with margin | |
| Mobile PageSpeed score | 62 | Needs improvement | |
| LCP | 3.4 sec | Needs improvement | |
| INP | 180 ms | Good | |
| CLS | 0.07 | Good |
Next, compare the same metrics with:
- The previous 30 days
- The same period last year, if available
- Mobile traffic
- Desktop traffic
- New visitors
- Returning visitors
- Paid social
- Paid search
- Organic search
- Email traffic
This segmented comparison is more useful than one blended store average.
Mobile vs Desktop Conversion Benchmarks
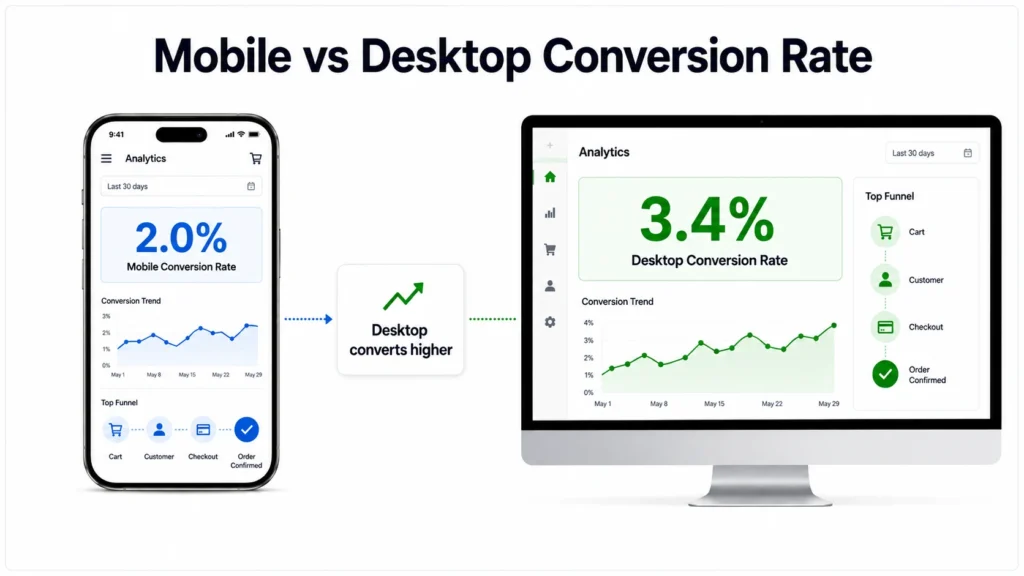
Mobile produces most ecommerce traffic, but desktop customers often convert at a higher rate.
Contentsquare’s 2026 benchmark reported:
| Device | Average conversion rate |
| Mobile | 2% |
| Desktop | 3.4% |
Desktop conversion was approximately 74% higher, while mobile accounted for nearly 70% of traffic. Contentsquare’s 2026 conversion benchmark
Do not interpret a lower mobile conversion rate as normal without investigating it. A large gap may reveal problems such as:
- Slow product pages
- Difficult navigation
- Small tap targets
- Hard-to-use product filters
- Poor image galleries
- Sticky elements covering content
- Complicated variant selection
- Unexpected shipping costs
- Payment methods unsuitable for mobile shoppers
- Discount-code fields distracting customers
Calculate Your Device Gap
Use this formula:
Your mobile rate is 50% lower than your desktop rate.
A gap does not prove that speed is the cause, but it tells you where to investigate first.
Conversion Benchmarks by Traffic Source
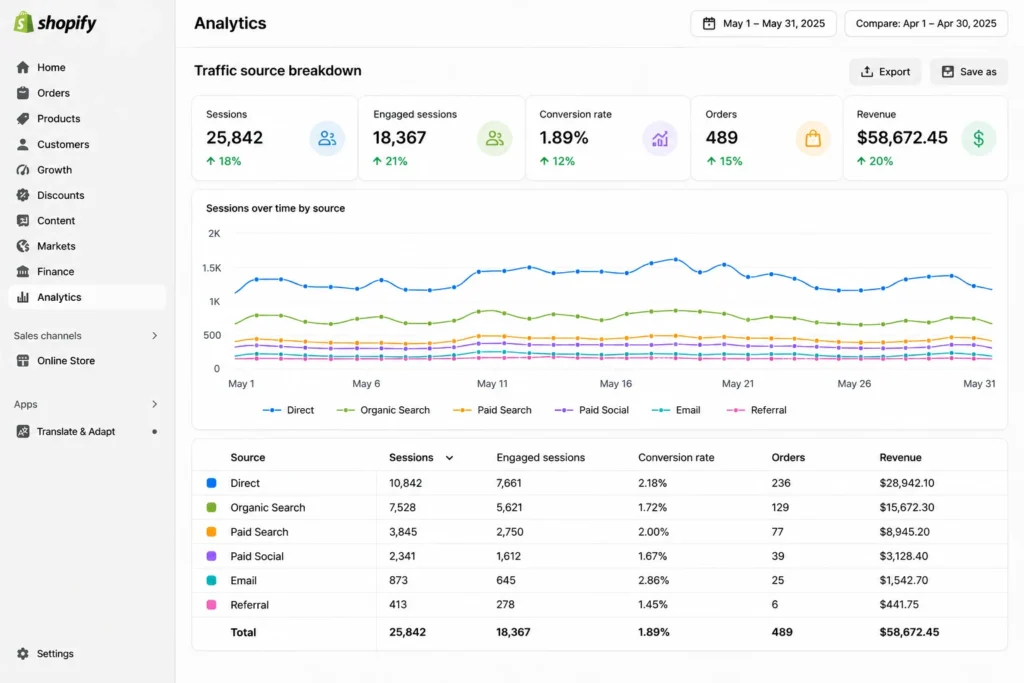
Customers arriving from different channels have different levels of purchase intent.
| Traffic source | Typical intent | How to assess it |
| High | Compare campaigns, automated flows, and returning customers | |
| Branded search | High | Check product availability and landing-page relevance |
| Non-branded search | Medium to high | Separate informational and commercial queries |
| Paid search | Medium to high | Compare each campaign and keyword group |
| Direct traffic | Mixed | Check returning customers and attribution limitations |
| Organic social | Low to medium | Review assisted sales and engagement |
| Paid social | Low to medium | Separate prospecting from retargeting |
| Referral | Varies | Assess each partner or referring site |
Do not compare a cold paid-social campaign with an abandoned-cart email flow. The audiences are at different points in the buying journey.
If conversion falls after increasing advertising spend, segment the new traffic before redesigning the store. The website may not be broken. You may simply be sending more low-intent visitors to it.
Shopify Funnel Benchmarks
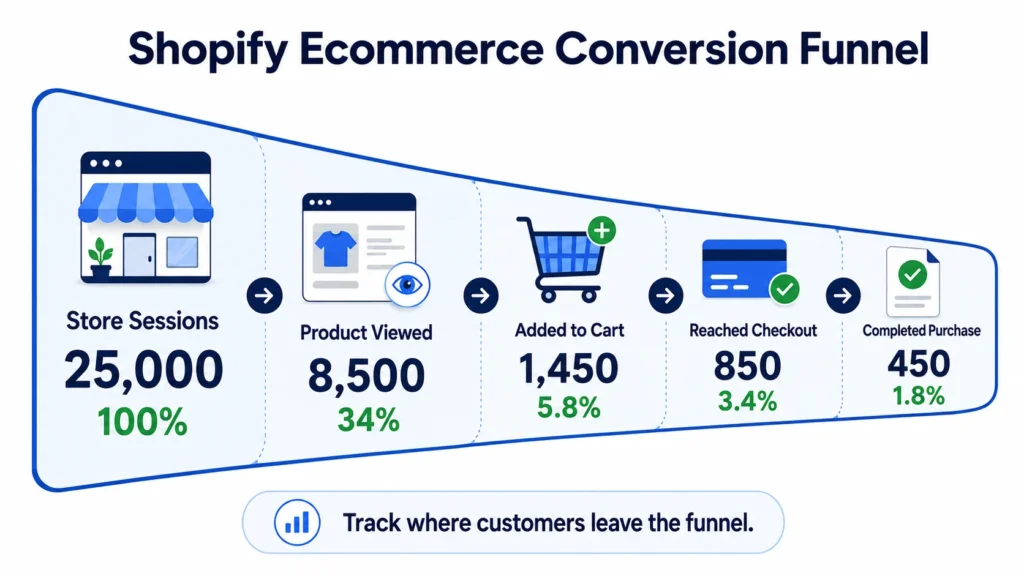
Your overall conversion rate tells you the final result. It does not show where customers leave.
Review this sequence:
flowchart TD
A[“Store session”] –> B[“Product viewed”]
B –> C[“Added to cart”]
C –> D[“Reached checkout”]
D –> E[“Completed purchase”]
Use Shopify’s conversion reports to record:
| Funnel stage | Example sessions | Percentage of all sessions |
| Store sessions | 25,000 | 100% |
| Added to cart | 1,450 | 5.8% |
| Reached checkout | 850 | 3.4% |
| Completed checkout | 450 | 1.8% |
Do not treat these example percentages as universal targets. Compare your funnel against its own previous performance and examine the size of each drop.
Low Add-to-Cart Rate
If many customers view products but few add anything to the cart, examine:
- Product pricing
- Product-market fit
- Image quality
- Product descriptions
- Reviews and trust signals
- Size, material, or specification information
- Shipping details
- Delivery estimates
- Returns information
- Variant availability
- Add-to-cart visibility
- Mobile product-page usability
Start with your most-visited product pages. A sitewide redesign is unnecessary if the weakness comes from a handful of products or poor-quality advertising traffic.
Strong Add-to-Cart but Low Checkout Rate
If customers add products but do not begin checkout, inspect:
- Unexpected shipping costs
- A confusing cart drawer
- Missing delivery estimates
- Coupon-code distractions
- Forced account creation
- Poorly presented return policies
- Upsells blocking the checkout button
- Cart errors
- Slow cart updates
- Missing payment information
Test the cart yourself on a phone using a new customer session.
Strong Checkout Rate but Low Completion
If customers reach checkout but do not purchase, check:
- Payment failures
- Missing payment methods
- Delivery restrictions
- High final shipping costs
- Taxes appearing late
- Address validation problems
- Discount-code errors
- Lack of guest checkout
- Trust concerns
- Checkout speed
- Mobile form usability
Shopify defines checkout conversion as completed purchases divided by sessions that reached checkout. Use that report to separate checkout problems from earlier product-page and cart problems. Shopify Analytics definitions
Cart-Abandonment Benchmark
Baymard’s analysis of 50 studies places the average documented cart-abandonment rate at 70.22%. Baymard cart-abandonment research
That means roughly seven out of ten carts do not become orders.
Use this practical interpretation:
| Cart-abandonment rate | Assessment |
| Below 60% | Strong |
| 60%–69% | Better than the broad average |
| 70%–75% | Common but worth improving |
| Above 75% | Investigate cart and checkout barriers |
A high rate does not always mean the cart is defective. Some customers add products to compare prices, save items, or check shipping costs.
Pay greater attention when abandonment rises suddenly or affects a particular device, country, product, or traffic source.
Shopify Speed Benchmarks
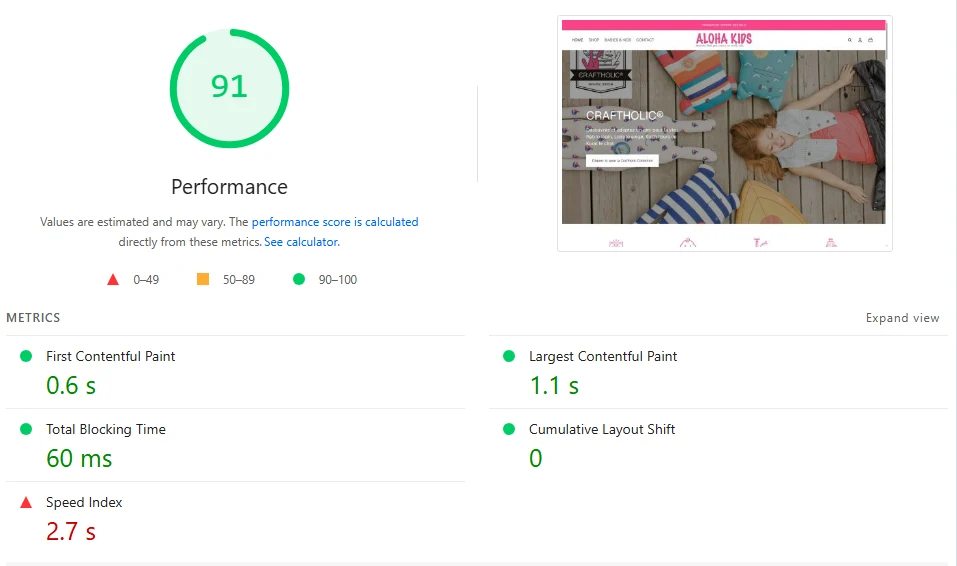
PageSpeed Insights uses Lighthouse to create a laboratory score from 0 to 100.
Google’s official categories are:
| PageSpeed score | Google rating |
| 90–100 | Good |
| 50–89 | Needs improvement |
| 0–49 | Poor |
For functioning Shopify stores, use these practical mobile ranges:
| Mobile score | Practical assessment | Recommended response |
| 0–29 | Critical | Audit scripts, media, apps, and theme code |
| 30–49 | Poor | Fix the largest sitewide bottlenecks |
| 50–69 | Fair | Improve high-traffic templates first |
| 70–89 | Strong | Make selective changes |
| 90–100 | Excellent | Maintain and monitor |
A mobile score of 70 or higher is a reasonable operational target, but it is not Google’s official good category. For a full explanation, link to your separate article: What Is a Good Shopify Store Speed Score?
Core Web Vitals Benchmarks
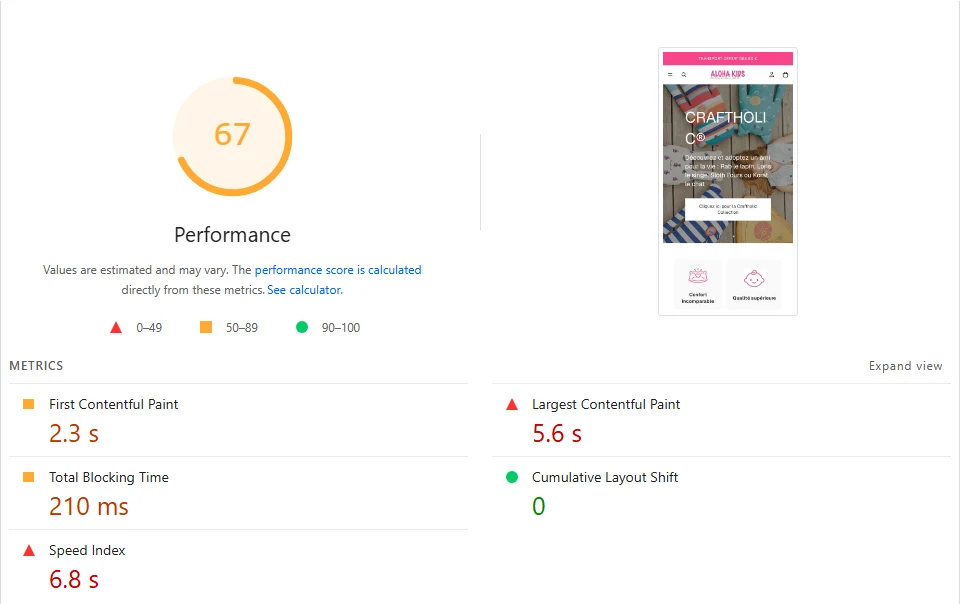
Shopify’s Web Performance reports measure three parts of the customer experience:
| Metric | Good | Needs improvement | Poor |
| LCP | ≤2.5 sec | 2.5–4 sec | >4 sec |
| INP | ≤200 ms | 200–500 ms | >500 ms |
| CLS | ≤0.1 | 0.1–0.25 | >0.25 |
Shopify uses real visitor data to report loading speed, interactivity, and visual stability. Its Web Performance summary is based on the previous 30 days and evaluates performance at the 75th percentile. Shopify Web Performance reports
If LCP Fails
Check large hero banners, product images, sliders, videos, server response, fonts, and render-blocking resources.
If INP Fails
Check app JavaScript, variant selectors, product filters, search, cart drawers, popups, analytics tags, and long browser tasks.
If CLS Fails
Check images without dimensions, late-loading review widgets, announcement bars, dynamic recommendations, font changes, and app blocks that appear after the page loads.
Does a Faster Shopify Store Convert Better?
Usually, but a higher PageSpeed score does not guarantee higher sales.
Poor speed can stop customers from:
- Seeing the product quickly
- Selecting a variant
- Opening a collection filter
- Adding a product to the cart
- Using the menu
- Completing checkout
However, conversion can remain low on a fast store when:
- Traffic is poorly targeted.
- The offer is weak.
- Prices are uncompetitive.
- Product images are unconvincing.
- Shipping is expensive.
- The store lacks trust.
- Important product information is missing.
- Customers cannot find the right item.
Speed removes friction. It does not create product demand.
Find Out Whether Speed Is Hurting Conversions
Use this process instead of assuming that every conversion problem is caused by performance.
Step 1: Identify the Weak Segment
Compare conversion by device, source, landing page, country, and customer type.
Step 2: Check Performance for That Segment
If mobile paid-social traffic converts poorly, test the actual mobile landing pages used by those advertisements.
Step 3: Find the Failed Interaction
Use the store as a customer:
- Open the landing page.
- Browse the product images.
- Select a variant.
- Add the item to the cart.
- Open the cart.
- Begin checkout.
Record slow responses, page movement, errors, and unclear information.
Step 4: Change One Major Variable
Examples include:
- Compressing the main product image
- Removing an unused popup
- Fixing a delayed variant selector
- Simplifying the cart drawer
- Showing shipping information earlier
Do not change the theme, apps, prices, copy, and advertising at the same time.
Step 5: Measure the Result
Compare:
- Conversion rate
- Add-to-cart rate
- Reached-checkout rate
- Checkout completion rate
- Revenue per session
- Core Web Vitals
- Mobile PageSpeed result
Run the test long enough to collect meaningful traffic.
Prioritize the Right Problem
Use this decision table after collecting your data:
| Speed | Conversion | Likely priority |
| Poor | Poor | Fix technical and customer-journey problems together |
| Good | Poor | Investigate traffic, offer, trust, product pages, and checkout |
| Poor | Good | Optimize carefully without damaging profitable features |
| Good | Good | Test selective improvements and protect current performance |
Poor Speed and Poor Conversion
Begin with pages receiving the most qualified traffic. Fix broken interactions, failed Core Web Vitals, and obvious buying barriers.
Good Speed and Poor Conversion
Do not continue chasing a PageSpeed score of 100. Investigate:
- Traffic quality
- Pricing
- Product presentation
- Reviews
- Shipping
- Returns
- Payment methods
- Product availability
- Checkout errors
Poor Speed and Good Conversion
Your offer is probably working despite the technical friction. Make controlled changes on a duplicate theme and monitor revenue after every release.
Good Speed and Good Conversion
Avoid unnecessary redesigns. Test one improvement at a time and use the existing performance as your baseline.
Create Your Store Benchmark
External averages are useful for context, but your previous results are usually the fairest comparison.
Complete this worksheet every month:
| Metric | Previous 30 days | Current 30 days | Change | Next action |
| Sessions | 22,500 | 25,000 | +11.1% | Review traffic quality |
| Conversion rate | 2.1% | 1.8% | -14.3% | Segment by channel |
| Mobile conversion | 1.5% | 1.2% | -20% | Audit mobile journey |
| Desktop conversion | 3.0% | 3.1% | +3.3% | Maintain |
| Add-to-cart rate | 6.2% | 5.8% | -6.5% | Check product pages |
| Checkout conversion | 55% | 52.9% | -3.8% | Review checkout |
| Average order value | $64 | $68 | +6.3% | Check total profit |
| Revenue per session | $1.34 | $1.22 | -9% | Prioritize conversion |
| Mobile PageSpeed | 58 | 62 | +6.9% | Continue selectively |
| LCP | 3.8 sec | 3.4 sec | Improved | Fix main image |
The example store gained traffic and average order value, but conversion and revenue per session fell. Its first task should be to investigate new traffic sources and the mobile product journey.
It should not celebrate the PageSpeed improvement and ignore the revenue decline.
A 30-Day Improvement Plan
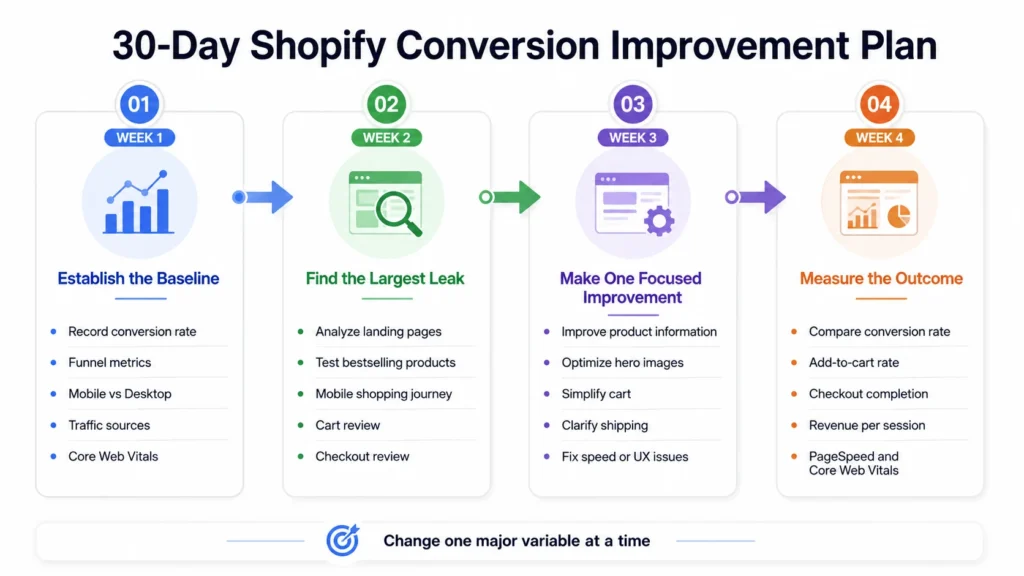
Week 1: Establish the Baseline
- Record conversion and funnel metrics.
- Segment mobile and desktop.
- Compare traffic sources.
- Test five important pages.
- Record Core Web Vitals.
Week 2: Find the Largest Leak
- Review high-traffic landing pages.
- Test bestselling products.
- Complete mobile purchases.
- Check the cart and checkout.
- Review customer complaints and support questions.
Week 3: Make One Focused Improvement
Choose the change most closely connected to the weak funnel stage.
Examples:
- Low add-to-cart rate: improve product information or variant usability.
- Low reached-checkout rate: simplify the cart and clarify shipping.
- Low checkout completion: investigate costs, payments, and errors.
- Poor LCP: fix the main image or banner.
- Poor INP: reduce script and app delays.
- Poor CLS: reserve space for media and app widgets.
Week 4: Measure the Outcome
Compare the same date length, traffic segments, pages, and metrics.
Keep the change when:
- The intended metric improves.
- Revenue does not decline.
- Important functionality still works.
- Tracking remains accurate.
- Customer support problems do not increase.
Final Benchmark Checklist
Before deciding that your Shopify store is underperforming, confirm that you have:
- Used at least 30 days of data
- Removed or filtered obvious bot traffic
- Compared the same measurement method
- Segmented mobile and desktop
- Reviewed each major traffic source
- Checked the complete purchase funnel
- Tested high-traffic pages
- Examined real-user Core Web Vitals
- Considered average order value and revenue per session
- Compared results with your own previous period
My direct opinion: treat a 2% conversion rate as a useful starting point, not a final goal. If qualified traffic converts below 1%, investigate immediately. If the store converts above 3%, protect what already works and test carefully.
The most useful benchmark is not a universal industry average. It is whether the same store now converts more qualified visitors, earns more revenue per session, and provides a faster buying experience than it did before.